

A Happy Installation Crew
June. Historically El Paso’s hottest month of the year. This year was no exception, with more days at or above 100° (37.8° Celsius) than El Paso usually gets during an entire summer. Yes, this is the blog for which you solar energy fans have been waiting—an analysis of our first full monthly billing cycle while generating solar power, and during the highest demand month.
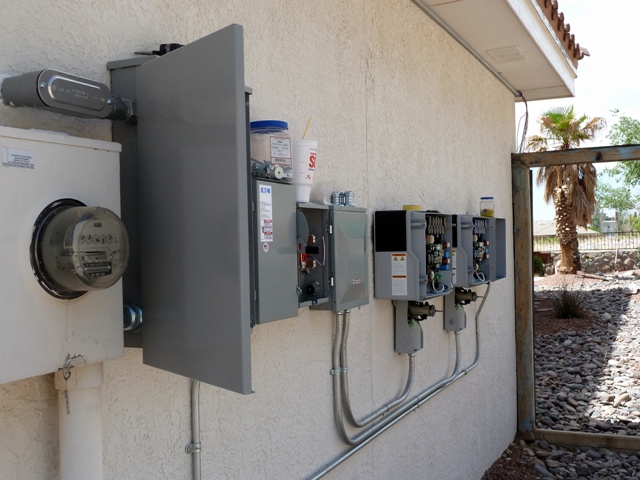
But, first, a correction. In the second blog I posted on this subject, I erroneously reported that it appeared we were getting about 55¢ back for every $1.00 in excess energy we produced. A nice young fellow from the El Paso Electric Company read that blog and called me up a few days later to better explain how to read the myriad meters and how to interpret the rather confusing billing. Thus I can now report that we were in fact getting a dollar-for-dollar credit.
Now that the housekeeping is out of the way, here are the numbers comparing June 2011 with June 2012:
|
June, 2011 |
June, 2012 |
|||
|
kWh Delivered to Home: |
2,630 |
kWh Delivered to Home: |
1,583 |
|
|
kWh Sent back to Elec. Co.: |
N/A |
kWh Sent back to Elec. Co.: |
759 |
|
|
Net Usage: |
2,630 |
Net Usage |
824 |
|
|
Cost (first 1,000 kWh): |
$87.45 |
Cost (first 1,000 kWh): |
$72.06 |
|
|
Cost (over 1,000 kWh): |
$134.39 |
Cost (over 1,000 kWh): |
N/A |
|
|
Fuel Charge: |
$66.47 |
Fuel Charge: |
$18.56 |
|
|
Customer Charge: |
$5.00 |
Customer Charge: |
$5.00 |
|
|
Cost Recovery Factor: |
$4.44 |
Cost Recovery Factor: |
$1.40 |
|
|
Military Recovery Factor: |
$0.86 |
Military Recovery Factor: |
$0.71 |
|
|
Total Charge: |
$298.61 |
Residential Service Credit: |
-$1.14 |
|
|
Total Charge: |
$96.59 |
|||
Impressive as those above figures may seem, there’s actually a whole lot more to the story. That 759 kWh sent back to the El Paso Electric Company was excess power over and above what we used during the daylight generating period. That means we were actually generating much more power than that 759 kWh would indicate—approximately 702 kWh more, or a total of 1,461 kWh for this billing cycle.
That means that my actual energy usage for June 2012 was actually around 2,265 kWh, or about 365 kWh less than June 2011. The reason for the lower usage is most likely due to the installation of outdoor window shading to the 216 square feet of window area in our great room. Those shades cut down the indoor heat transfer considerably, thus reducing the demand on our air conditioners somewhat even with this year’s brutal June heat wave.
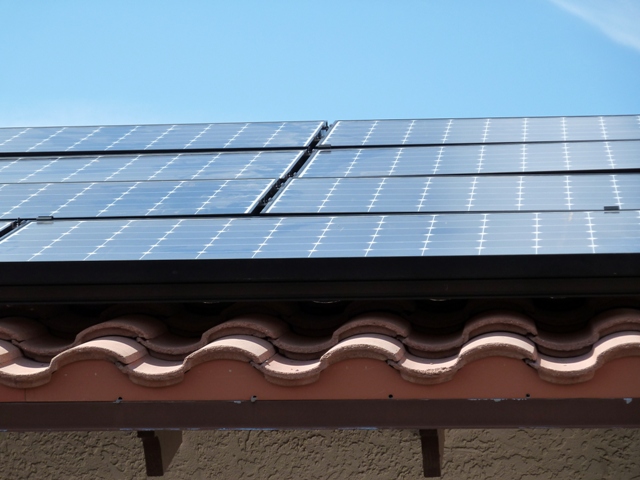
The solar panels generated on average 47.13 kWh a day during the 31-day billing cycle. Average daily energy use was 74.68. That means we self-generated during the month of June just over 63% of our electric energy needs. Over the course of a full year we should generate approximately 95% to 97%.
Time will tell, but for now we cannot adequately express how pleased we are with the first full month’s figures on our solar panel installation—$200 in savings the first month alone.


 Decisions — Murder in Paradise
 The Globe — Murder in Luxury